Although nationally home sales may be slipping, here in Greenville we seem to be just getting started. Our September 2018 numbers are down from last year and last month. However, the current demand on homes in the Greenville Area is still high and we are still in a Seller’s Market.
Please look at the numbers I have provided below, we ended 2017 with a bang having sold 1061 homes in the month of December. The numbers represent a month to month accounting and then year to year. It shows a steady rise in the closed number of homes. We have a fabulous growing economy.
Our number on homes is still strong in this seller’s market. Take advantage of the market here in The Upstate of SC, interest rates are still low for buying, and it’s a true sellers’ market, time to either sell or buy your next home! Take a look at the number tracking I have done for the past several years – numbers don’t lie!
Active Listings: 3,667 total homes on the market
Contingent contracts: 1,187 homes
Pending contracts: 732 homes
Closed homes (SOLD) breakdown per month and year
|
2011
|
2012
|
2013
|
2014
|
2015
|
2016
|
2017
|
2018
|
|
|
Jan
|
363
|
371
|
509
|
531
|
607
|
656
|
707
|
807
|
|
Feb
|
429
|
464
|
530
|
581
|
685
|
771
|
784
|
870
|
|
Mar
|
574
|
597
|
665
|
720
|
1015
|
1065
|
1157
|
1209
|
|
Apr
|
576
|
608
|
734
|
818
|
926
|
1066
|
1020
|
1147
|
|
May
|
584
|
650
|
963
|
950
|
1125
|
1227
|
1234
|
1400
|
|
Jun
|
647
|
705
|
846
|
998
|
1242
|
1313
|
1348
|
1357
|
|
Jul
|
611
|
708
|
986
|
942
|
1367
|
1172
|
1208
|
1240
|
|
Aug
|
694
|
772
|
922
|
995
|
1104
|
1147
|
1246
|
1311
|
|
Sep
|
538
|
608
|
770
|
973
|
1069
|
1149
|
1118
|
1046
|
|
Oct
|
437
|
660
|
751
|
975
|
930
|
998
|
982
|
|
|
Nov
|
470
|
611
|
702
|
719
|
706
|
925
|
988
|
|
|
Dec
|
458
|
625
|
693
|
849
|
924
|
950
|
1061
|
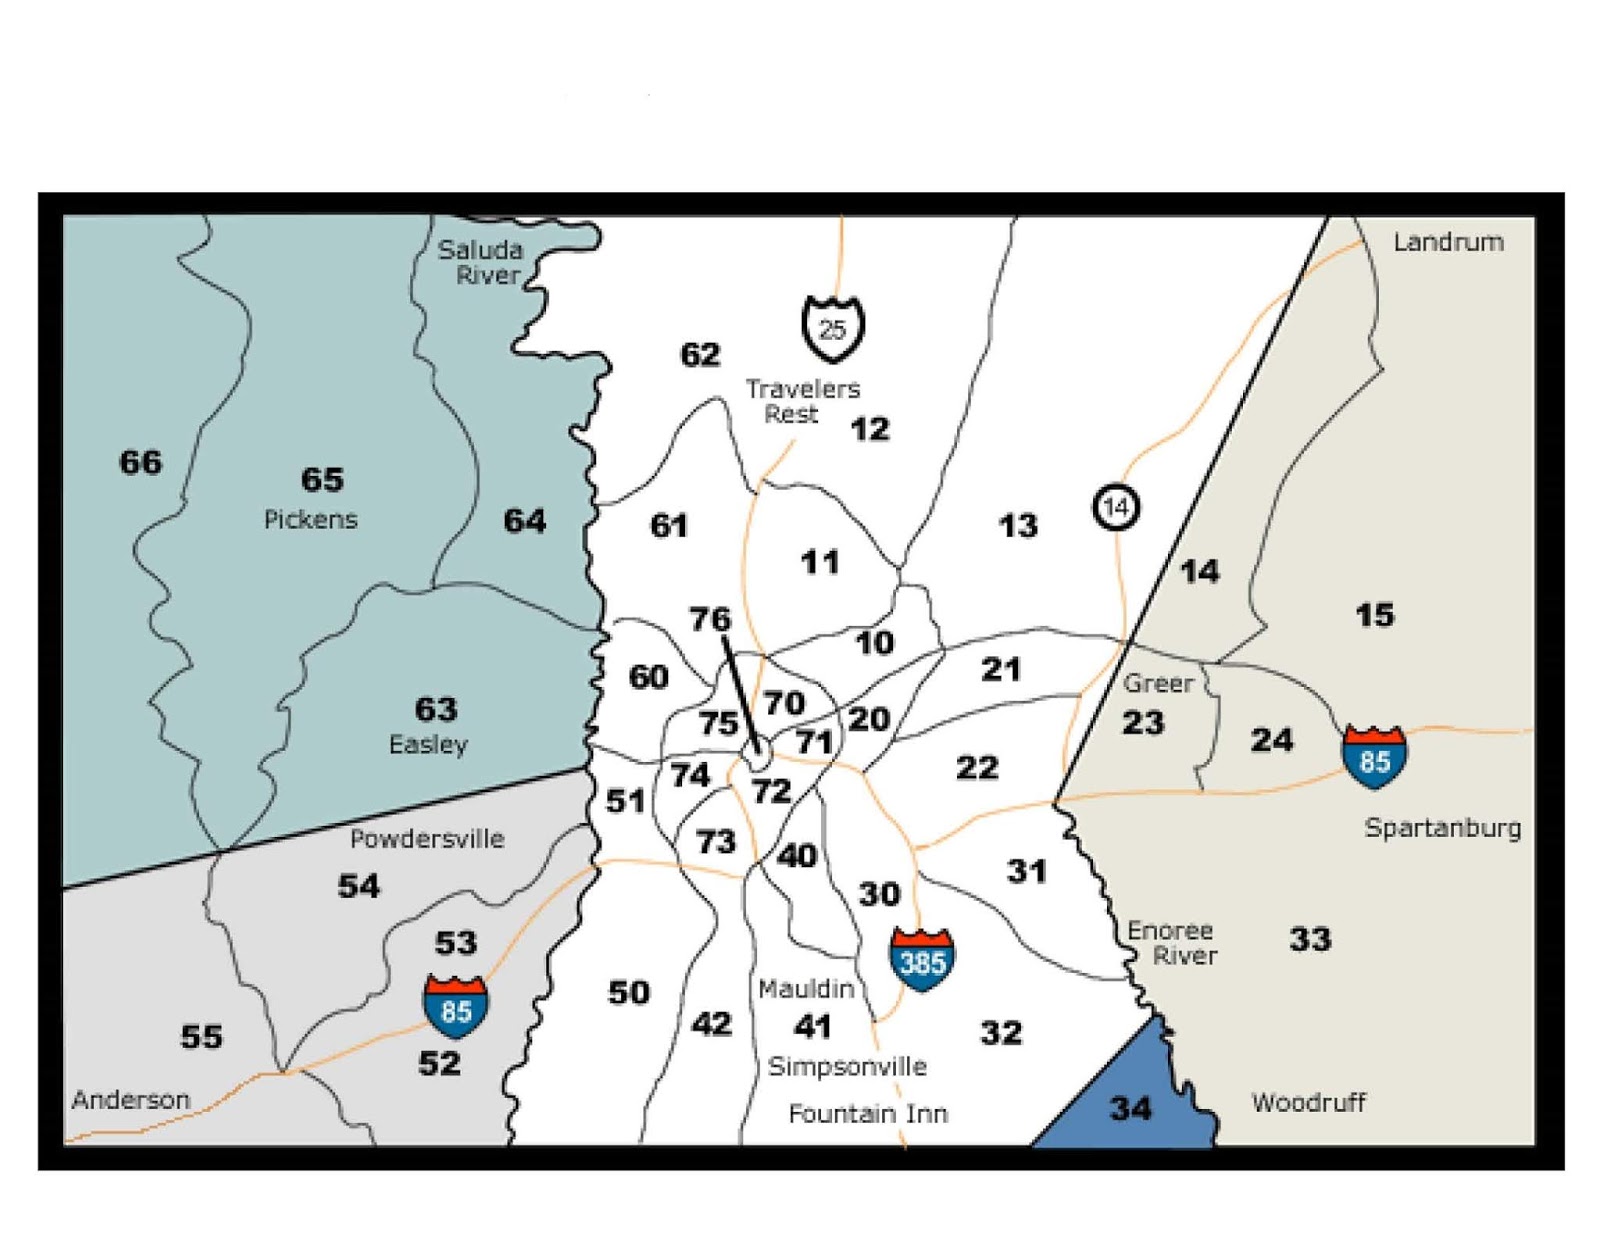
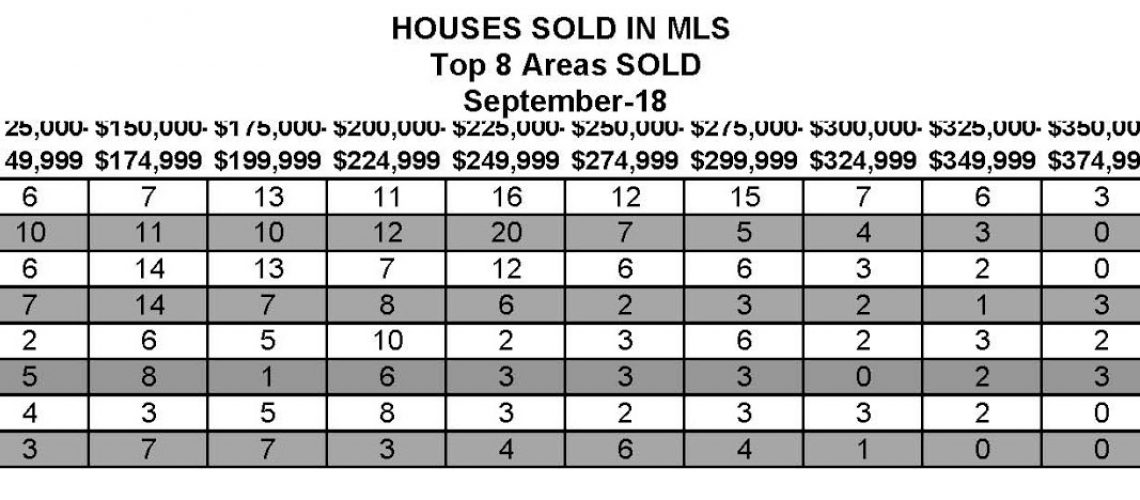
I have also pulled the top 8 selling areas for September. These top 8 areas are 32: Southern Gvl, 33: Spartanburg, 41: Spnvl/Mauldin/Fountain Inn, 15: Landrum/Inman/Wellfrd, 22: East Side, 63: Easley Area, 13: Blue Ridge/Hwy 14, and 21: East Side.

Looking at the map below of the MLS listing areas, we can see that the top selling areas are mostly outside of Greenville proper. Which tells me that baby boomers may be making most of the purchases in our area. The trend has been for millennials to buy in cities and urban areas where they can walk to work, eat and entertainment while baby boomers like to live on the outskirts of the city.
I also took a look at Trulia® real estate data for Greenville and their research shows that market trends would indicate an increase of $19,200 (10%) in median home sales over the past year. Average price per square foot also rose during this time from $119 to $132. One-bedroom properties rose +42.6%, two-bedroom properties rose +21.3%, three-bedroom properties rose +10.1% and four-bedroom properties rose +29.5% from June 27 to September 26, 2018.
We also find on Trulia® that they are indicating that median rent for all properties decreased to $1,200/month in October while the number of rentals increased to 467. We know that once interest rates start rising, potential homebuyers often make excuses to rent instead of buying a home. With another Fed increase this week, first-time homebuyers are feeling forced out of the market and are turning to renting.
And remember if you, a friend or family member need assistance with selling or buying a home I can help. Referrals and people needing relocation assistance are welcome! Search Single Family homes in Greenville. Search Condos and Townhomes in Greenville.

